memes.cjtrowbridge.com
Category: Anti-Capitalism - Housing -> This Meme
llama-3.2-vision
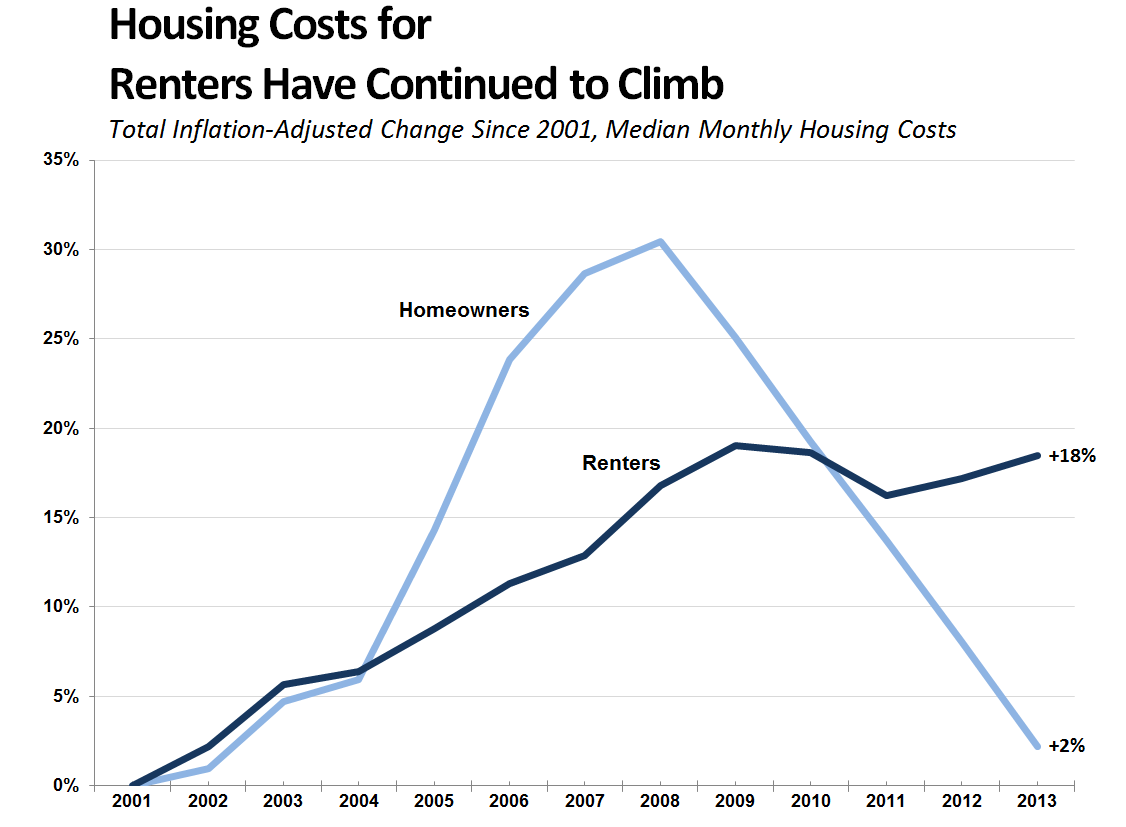
The meme is a graph showing the increase in housing costs for renters and homeowners from 2000 to 2013. The graph is titled "Housing Costs for Renters Have Continued to Climb" and includes a subheading "Inflation-Adjusted Change Since 2001". The graph shows a sharp increase in housing costs for both renters and homeowners, with renters experiencing a 35% increase in costs.
first-seen
2023-09-16T01:07:24+00:00
tesseract
Housing Costs for Renters Have Continued to Climb Total Inflation-Adjusted Change Since 2001, Median Monthly Housing Costs 35% 30% Homeowners 25% 20% Renters +18% 15% 10% 5% +2% 0% “3001 2002 2003 2004 2005 2006 + 2007 2008 +2009 | 2010 + 2011 +2012 | 2013